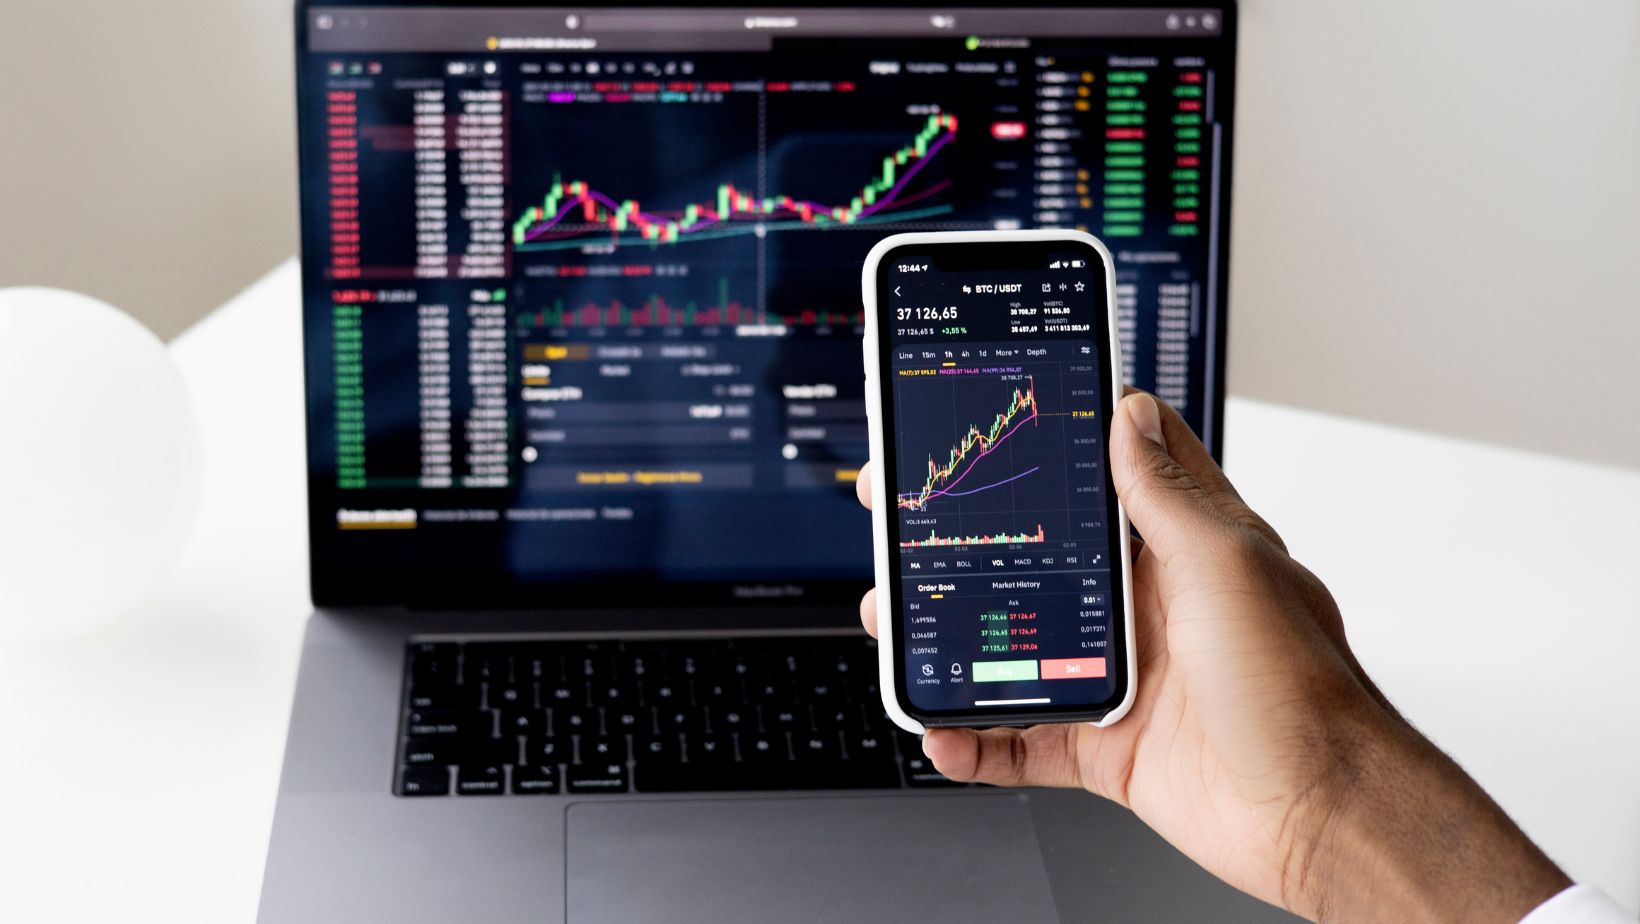
Traders use various tactics to profit from financial market movements. They often analyze the price chart and try to gauge its behavior to determine where the price is going. Technical indicators are often used to get deeper insights about price by analyzing its momentum and direction.
There are thousands of technical indicators available online and knowing which ones to use and how to tweak their settings can mean the difference between winning and losing the money in financial trading. Let’s explain what indicators are and how you can tweak them to determine what price is doing with utmost accuracy.
What Are Financial Trading Indicators?
Technical indicators are mathematical formulas that follow price and calculate various things to provide traders with critical information about price whereabouts. For example, moving averages show average prices of an asset over specified periods while RSI or Relative Strength Index indicates price momentum.

RSI, as an momentum oscillator, is extremely popular among day traders as it measures the speed and change of price movements. Default RS indicator settings are 14 but traders typically tweak them to their preferences such as trading strategy, asset, timeframe, and so on. Indicators take in historical data such as price, volume, to generate visual signals that greatly aid traders assess market conditions and make accurate entries and exits.
Financial Trading Indicator Types
There are several types of technical indicators, including trend, momentum, volatility, volume, and so on. Let’s briefly analyze the most popular indicators in each of these categories.
Trend Indicators
Trend indicators are the best when you are trying to catch a major price trend. These indicators follow price and visually indicate how strong the trend is and where it is heading. Popular indicators include moving averages and MACD. Moving averages just show average price for over a specified period which is a user-edited parameter.
The MACD shows the difference between 12 and 26-period EMAs (exponential moving averages) with a 9-period EMA signal line. MACD’s histogram is a great way to determine where the momentum is heading and traders can also edit its settings to tailor it to their strategies.
Momentum Indicators
Relative strength index or RSI is a solid oscillator among momentum indicators. Ranging between 0 and 100, it shows oversold and overbought levels and traders use these signals to understand where price is going and how likely it is to reverse. Another popular indicator which is also very useful is the Stochastic oscillator. It compares current close to a price range over user-specified periods to identify reversal zones. These indicators are also widely used for divergence trading, meaning that when the indicator is showing one thing and the price is doing another, it might be a good time for reversals.
Volatility Indicators
Among volatility indicators, Bollinger bands and Average True Range are kings. Bollinger bands measure a 20-period SMA with upper and lower bands +-2 standard deviations. These settings are editable and enable traders to fully customize the indicator according to their strategies. Traders should carefully calculate which settings to use not to make indicators too sensitive to small price changes.
Volumes
Volume is a powerful tool for financial traders that measures the actual strength behind each candle. There are several volume indicators including the default volume indicator itself, On-Balance volume (OBV), MFI or Money flow index, and so on.
OBV is a cumulative volume flow indicator and when it increases it indicates a strong bullish trend and when it decreases it is down days. Traders use OBV as an additional confirmation for their direction bias.
The MFI indicator combines price and volume and measures the purchasing and selling pressure of price which can be a powerful indicator for confirming signals.
How To Tweak Indicators
Indicators come with default values and when traders want to increase or decrease the sensitivity they might use different settings. In the case of momentum oscillators, lower period settings make indicators more sensitive to current price fluctuations. However, in this scenario, the indicator will produce more false signals as it will react to every little price fluctuation. Lower periods are generally used for scalping strategies while higher periods are better for longer-term trading strategies.

Let’s take the stochastic as an example. The default settings are 14,3,3 and the indicator is fairly sensitive. If a trader sets its settings to 5,3,3, then the indicator will immediately react to even small price changes, which might be useful for making it less laggy but you have to account for many false signals as well.
Overall, each trader should tweak indicators according to their trading strategies and assets. If you are scalper, then smaller periods will make indicators more sensitive to small price fluctuations which might be useful to catch small movements. However, if you want to trade using swing trading and trend trading strategies then you need moving averages and other indicators with longer period settings.


